Cloudkitchens Dashboard Maker
Transforming Analytics with No-Code Ease
Dashboard Maker was designed to empower internal teams and external customers to effortlessly create analytics dashboards using a no-code builder. Initially, my team faced the challenge of managing 20 dashboard requests per month, while only delivering 2-3 dashboards per quarter. To streamline efforts and eliminate redundancy, my team merged our initiative with a similar project from another team. Following an unexpected reorganization, I took on the project solo and brought it to completion. Since its release, Dashboard Maker has delivered 17 new customer-facing dashboards and 45 new internal-facing dashboards within the first month of release.
ROLE
Senior Platform Designer - Otter Analytics & Monitor (Customer Experience)
DESIGN COLLABORATOR
Mudit Mittal, Principal Product Designer - Analytics Studio (Internal Tooling)
Builder Framework
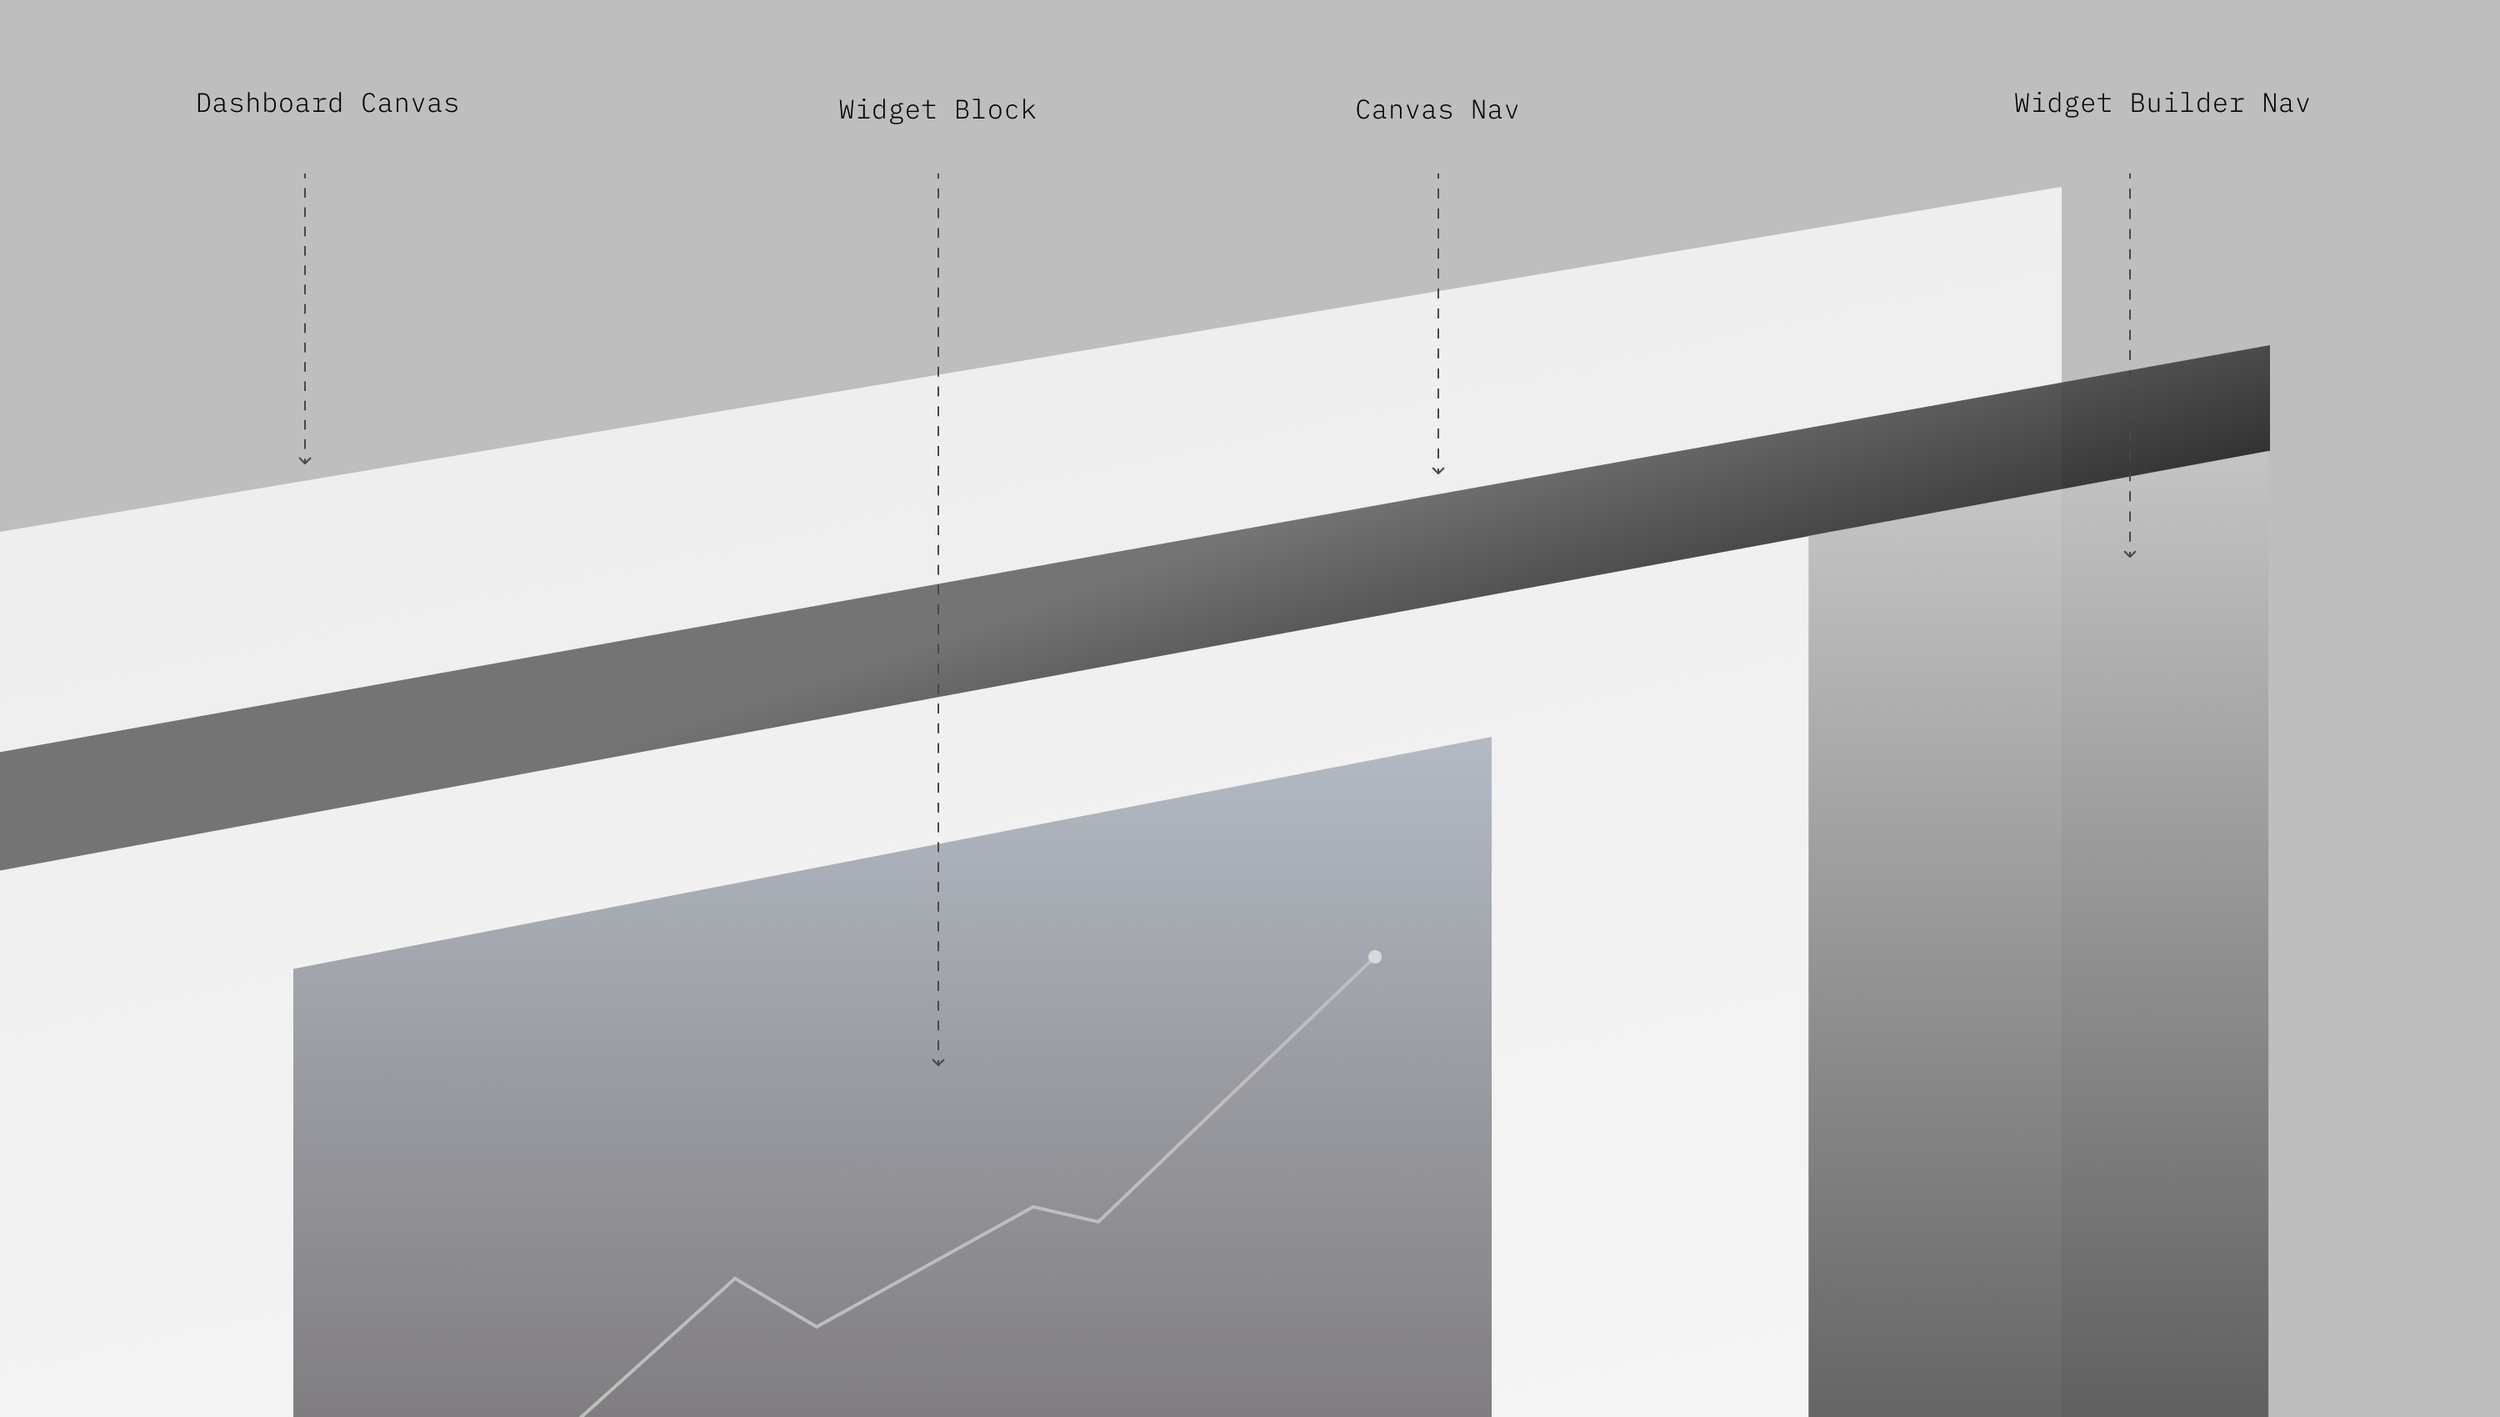
The builder was broken down into four main components:
Canvas - serves as the main area where widgets and text are placed and arranged to create the dashboard layout.
Widget Block - provides users a way to customize the widgets.
Canvas Navigation Bar - offers options for saving and previewing the dashboard.
Widget Builder Navigation - guides users through customizing each widget's data source, visualization settings, and interactions.
Canvas Hover States & Interactions
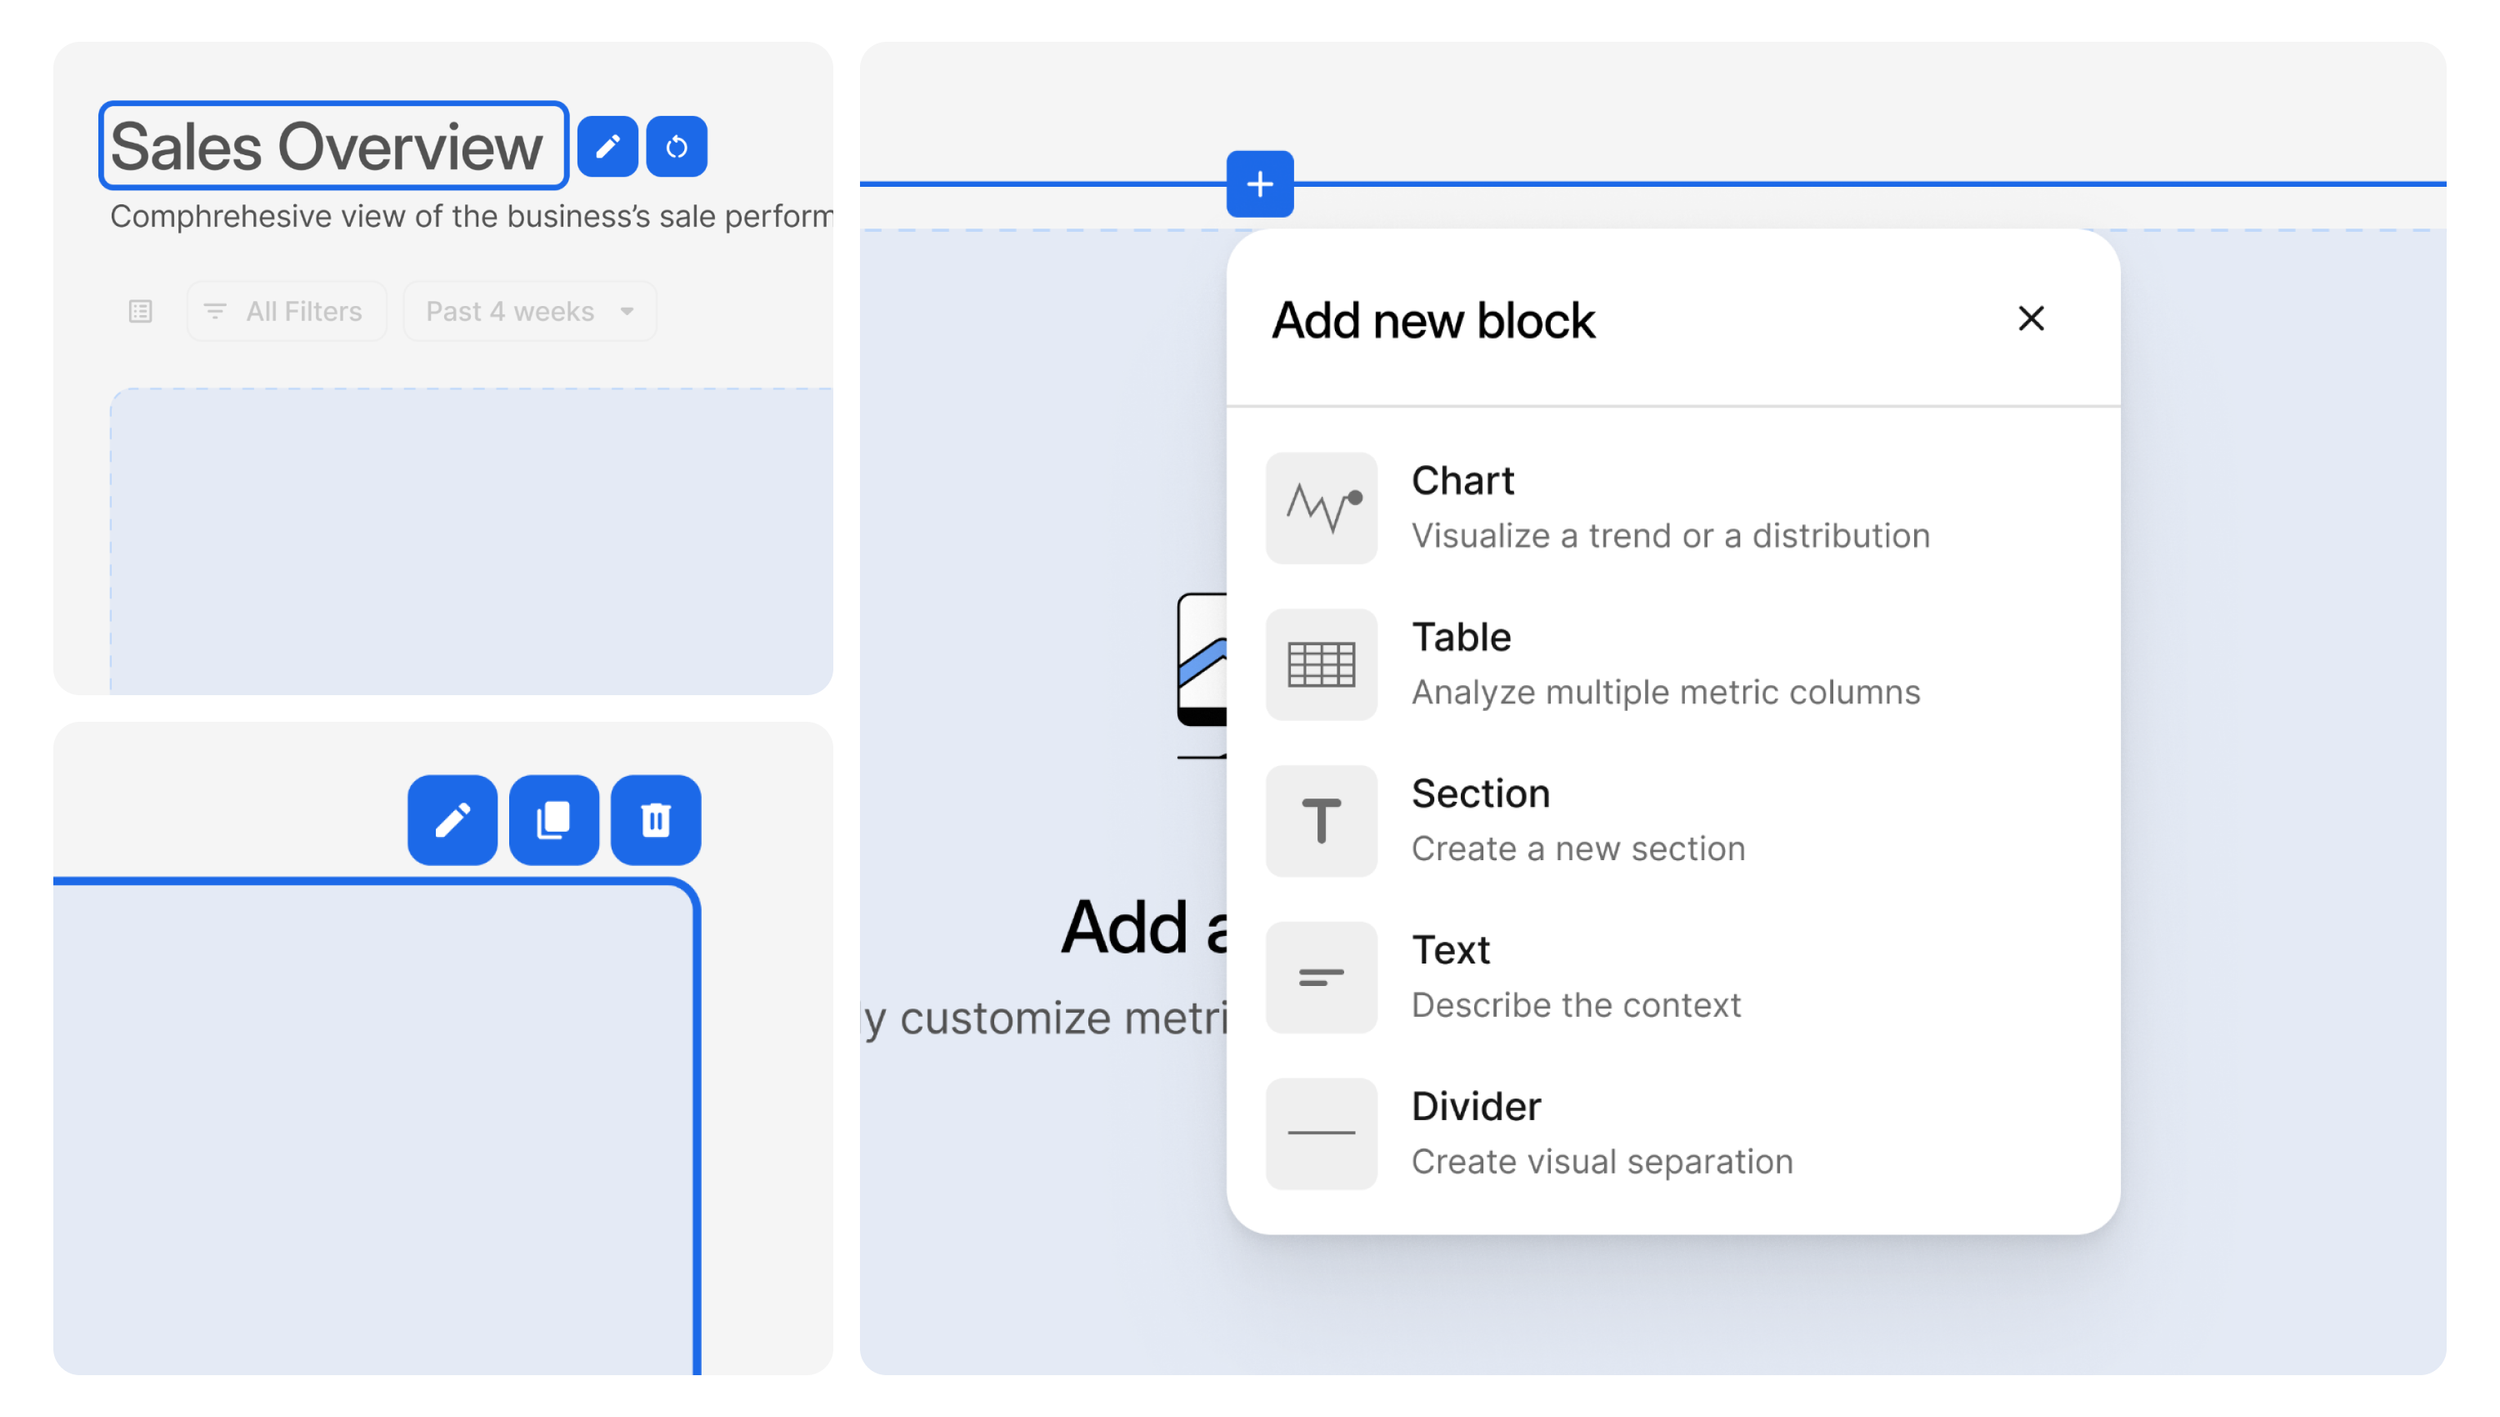
I create a whole new WYSIWYG interaction pattern for the canvas, allow users to directly add new widget blocks and rich text editing.
Widget Charts Details
I optimized our existing charts from our library to ensure they responded seamlessly to user placement and configuration on the canvas. Our initial launch featured three types of charts: line charts, bar charts, and scorecards, each solving most of our customers’ use cases.
Various line chart behaviors
Various bar chart behaviors
Various scorecard behaviors
Builder Panel Navigation
Widget builder allows users to see charts and tables configurations in real time.
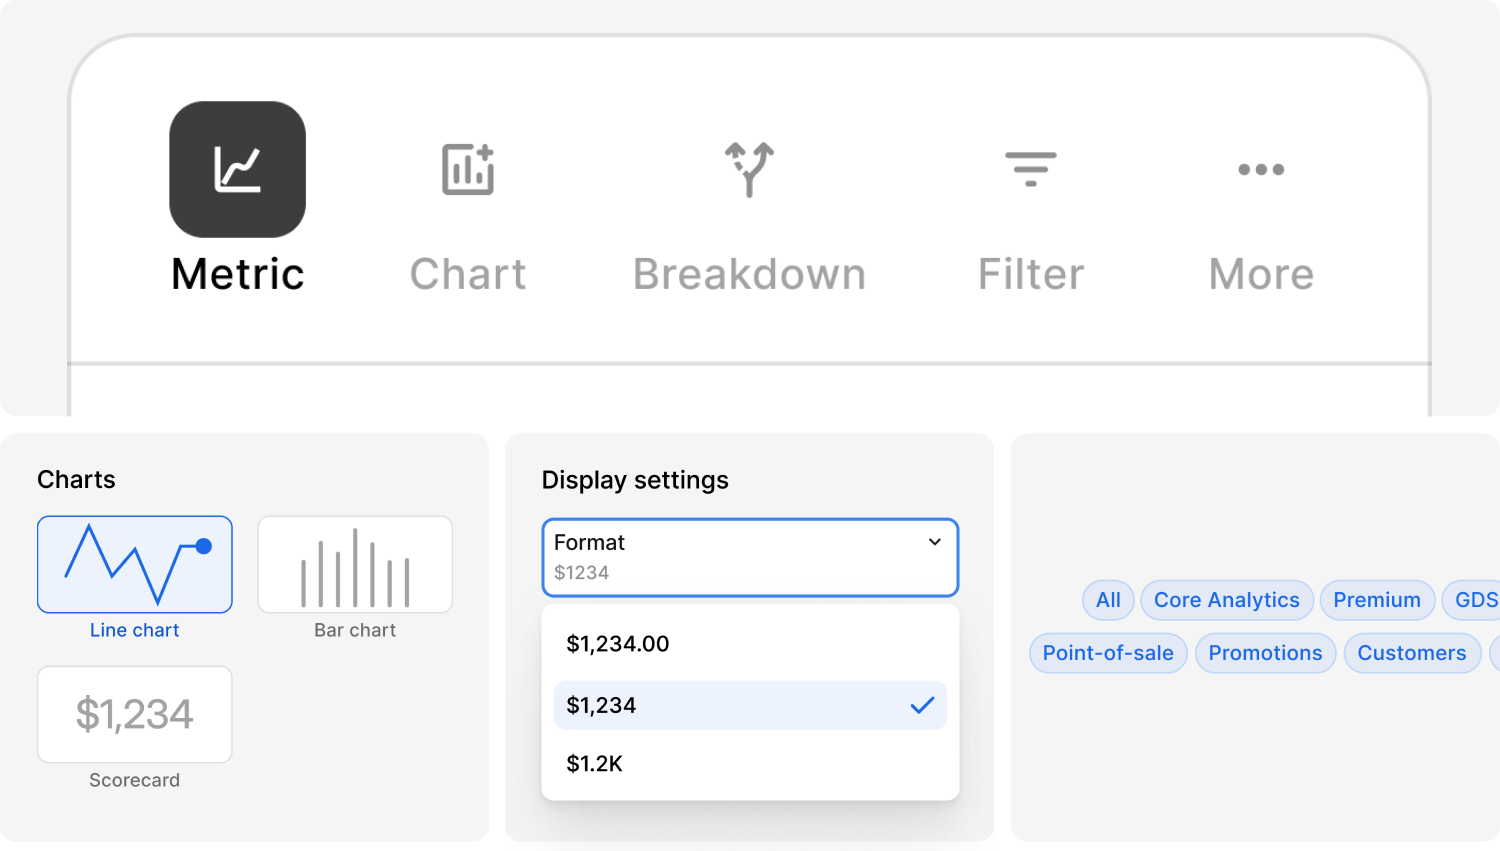
New components such as a rail navigation tab system, chart tiles, various display settings, and a new way to catalog metrics were designed.
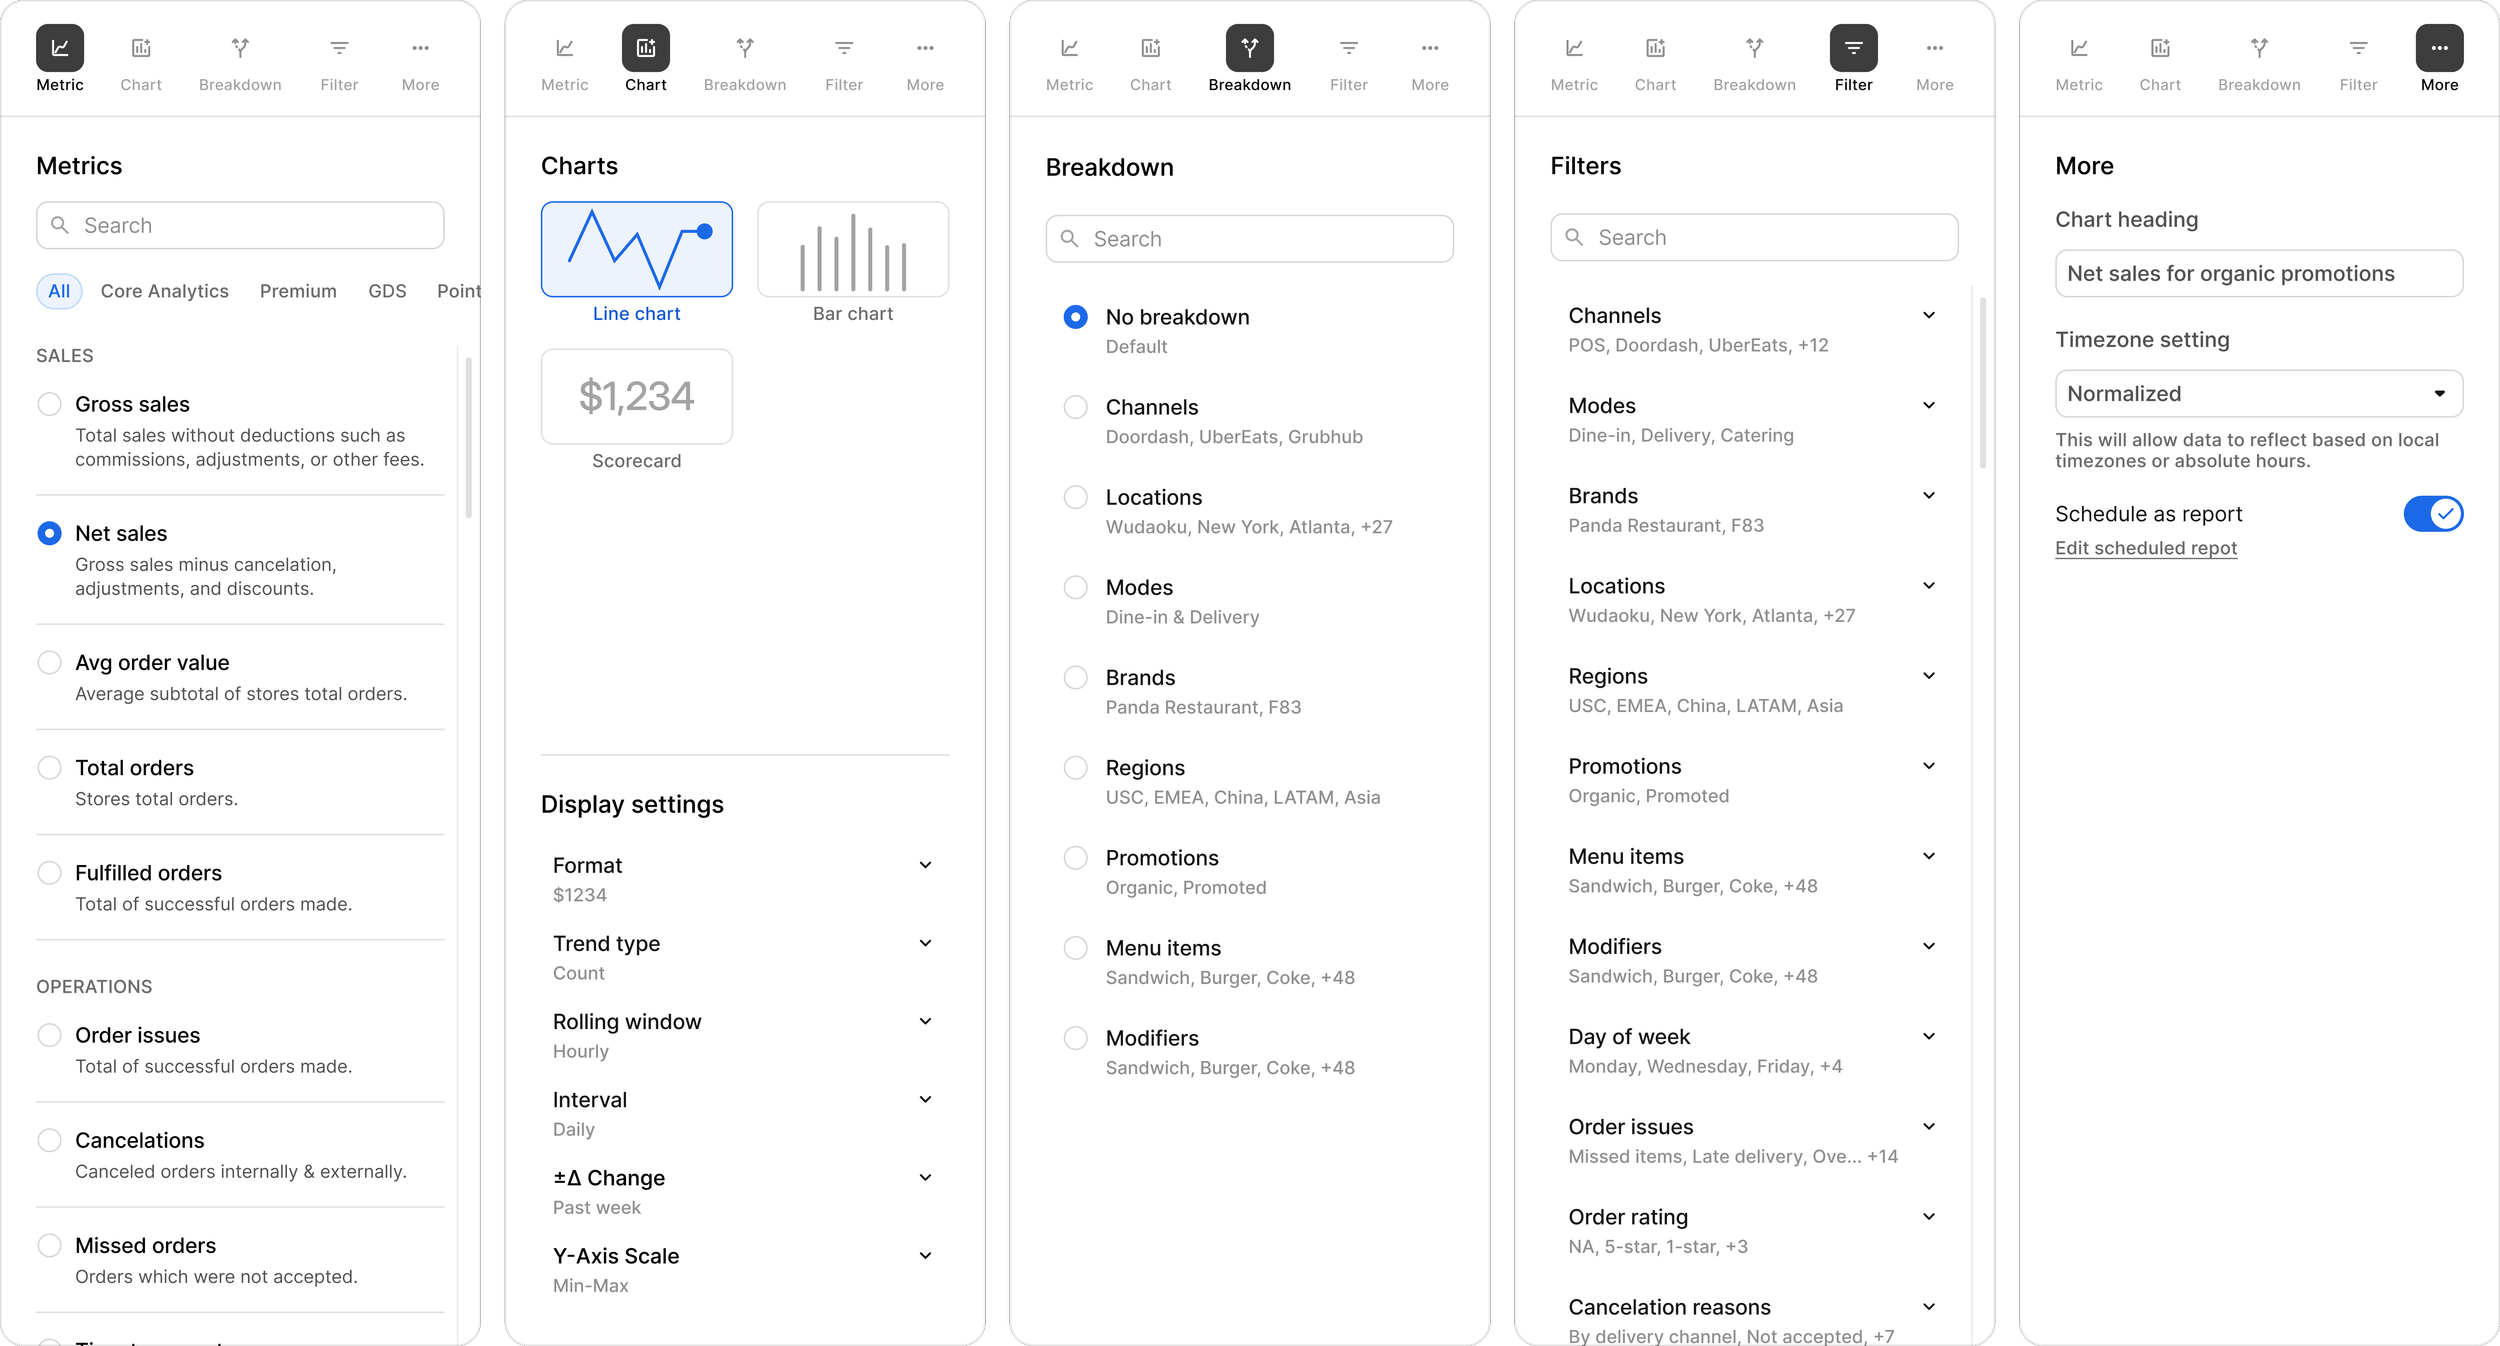
Overall builder panel navigation.
Canvas Nav Bar & Publishing
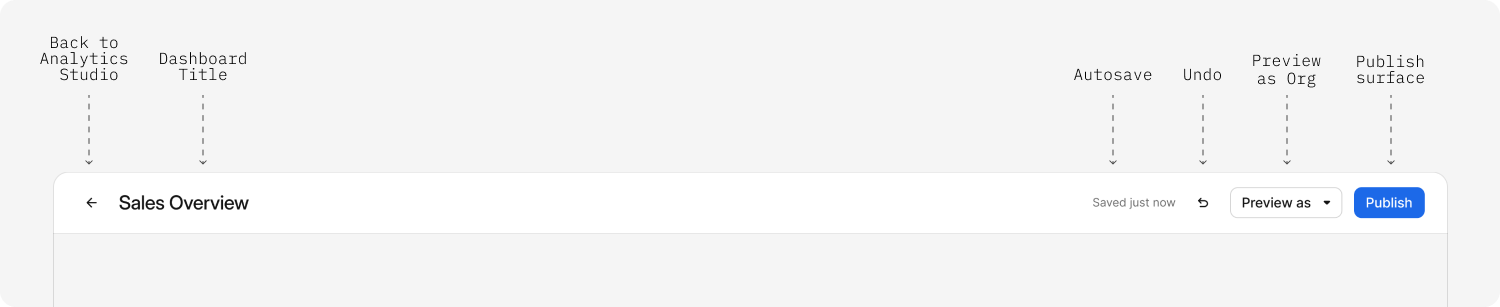
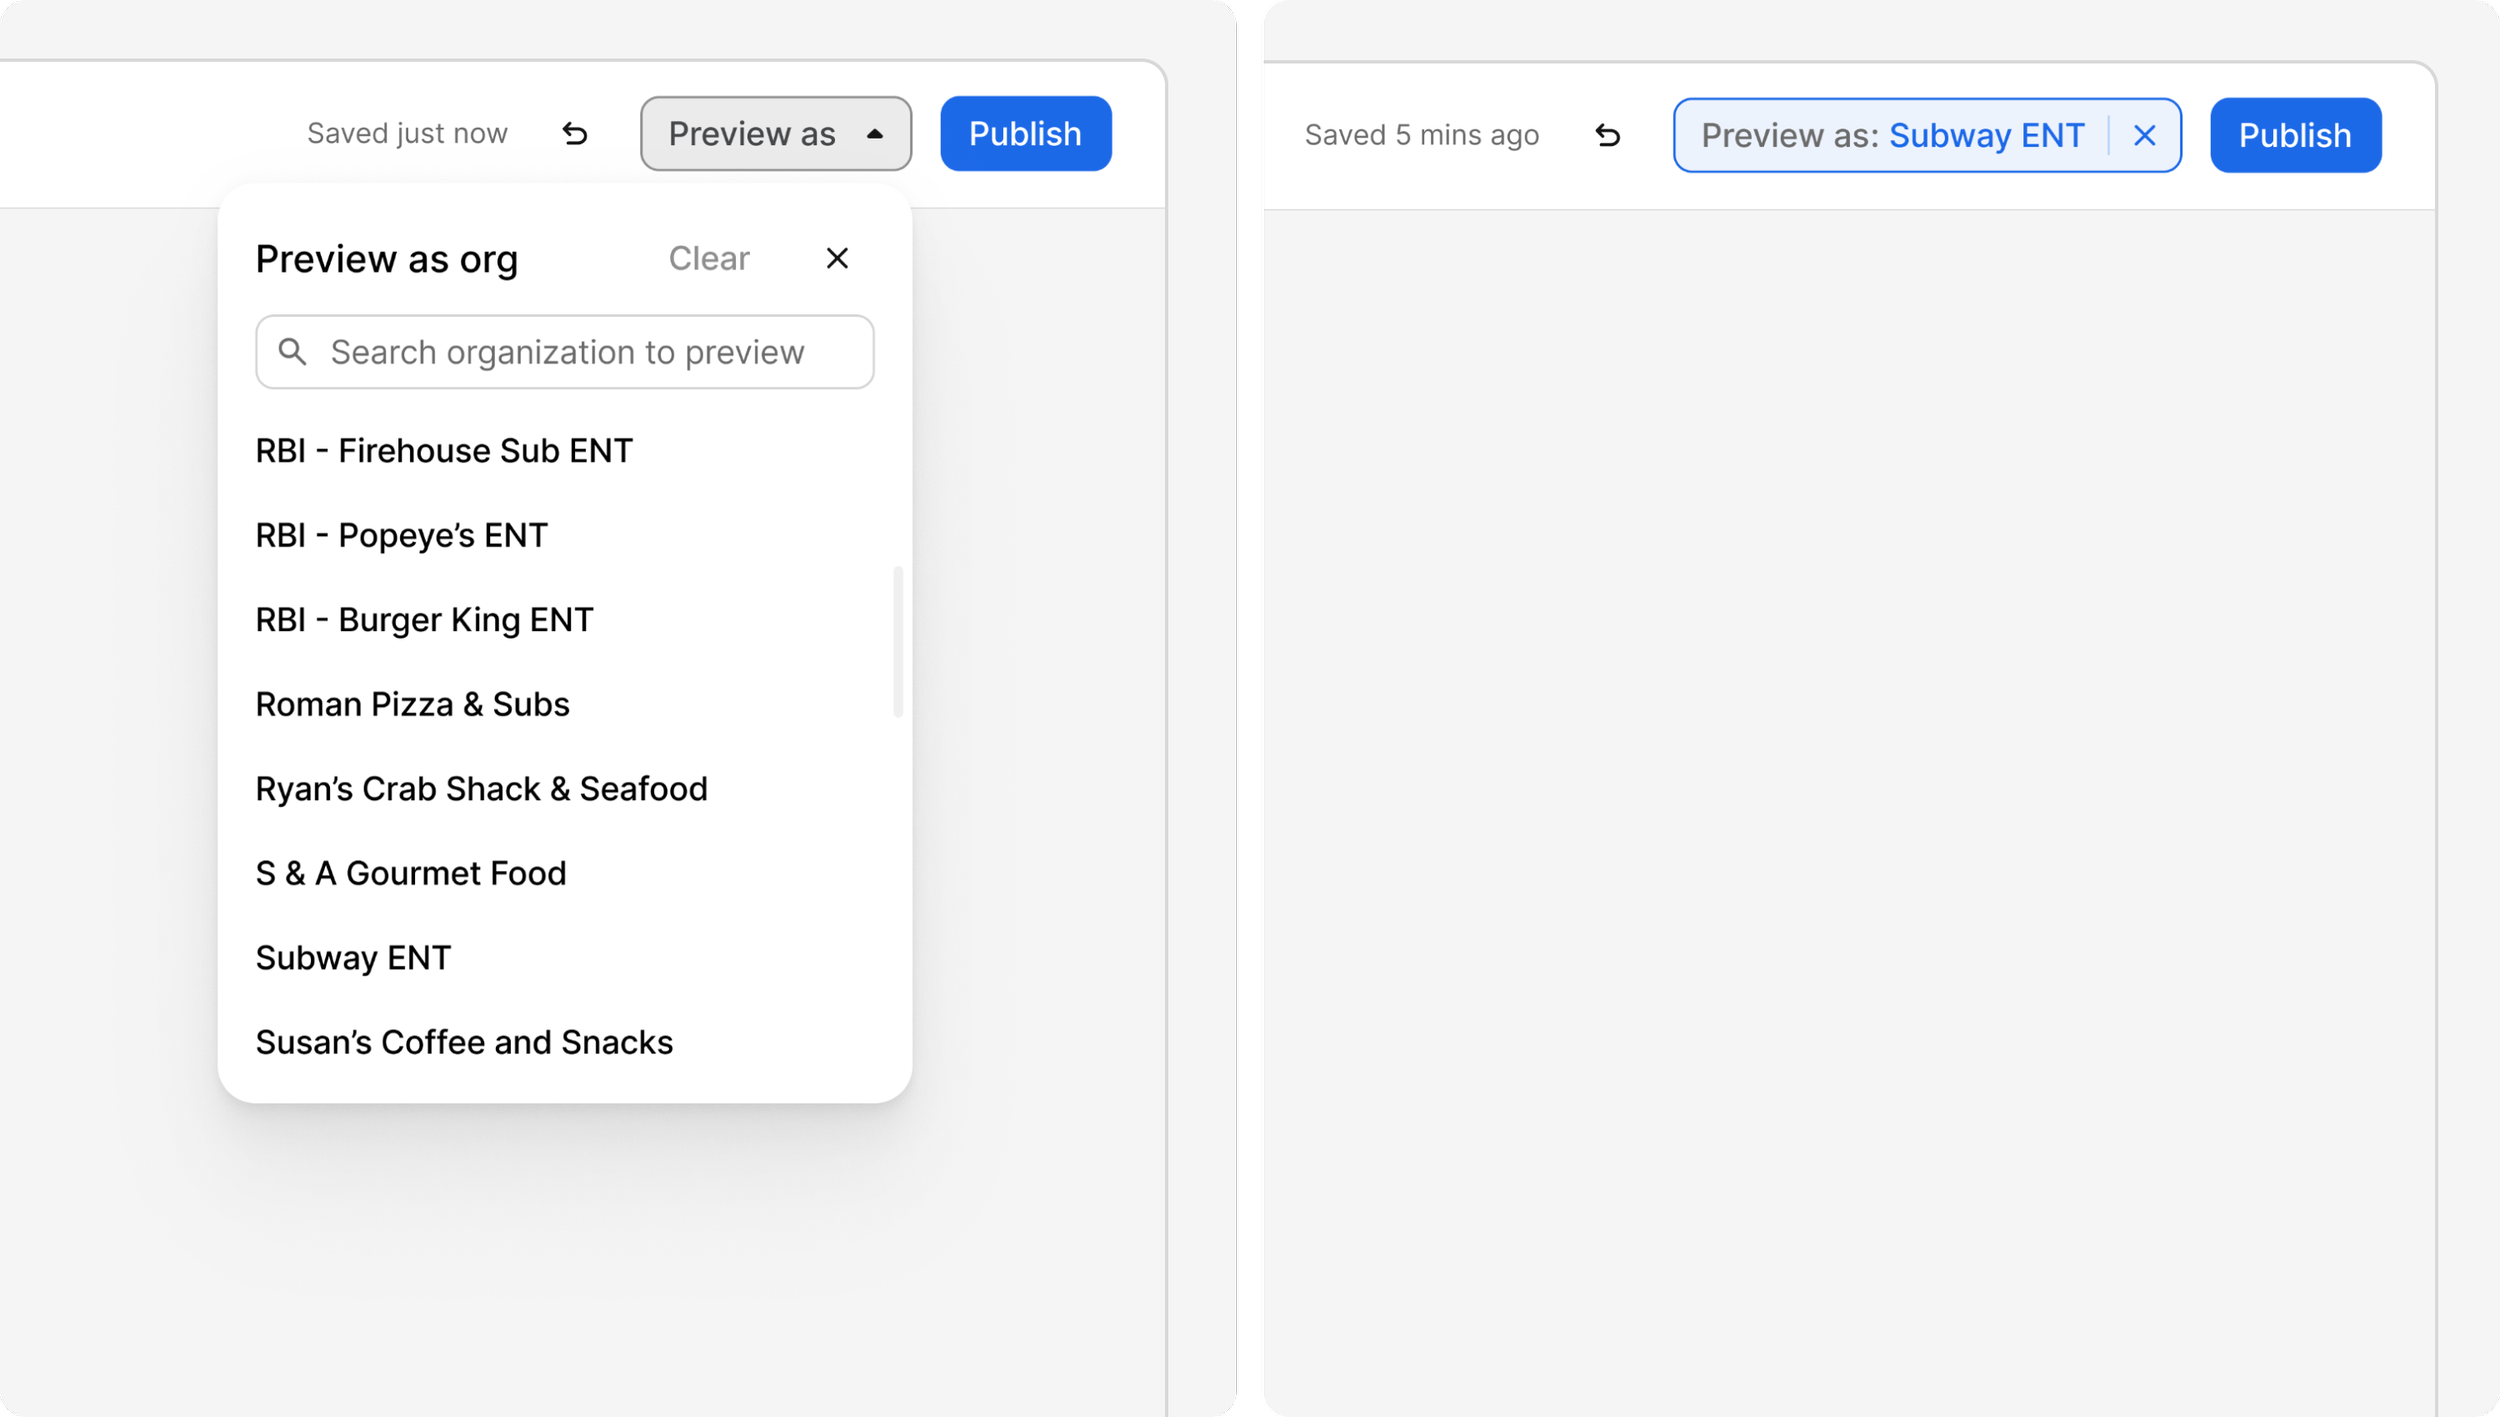
Canvas navigation allows user to not worrying about saving, undo changes, preview as the org before publishing.
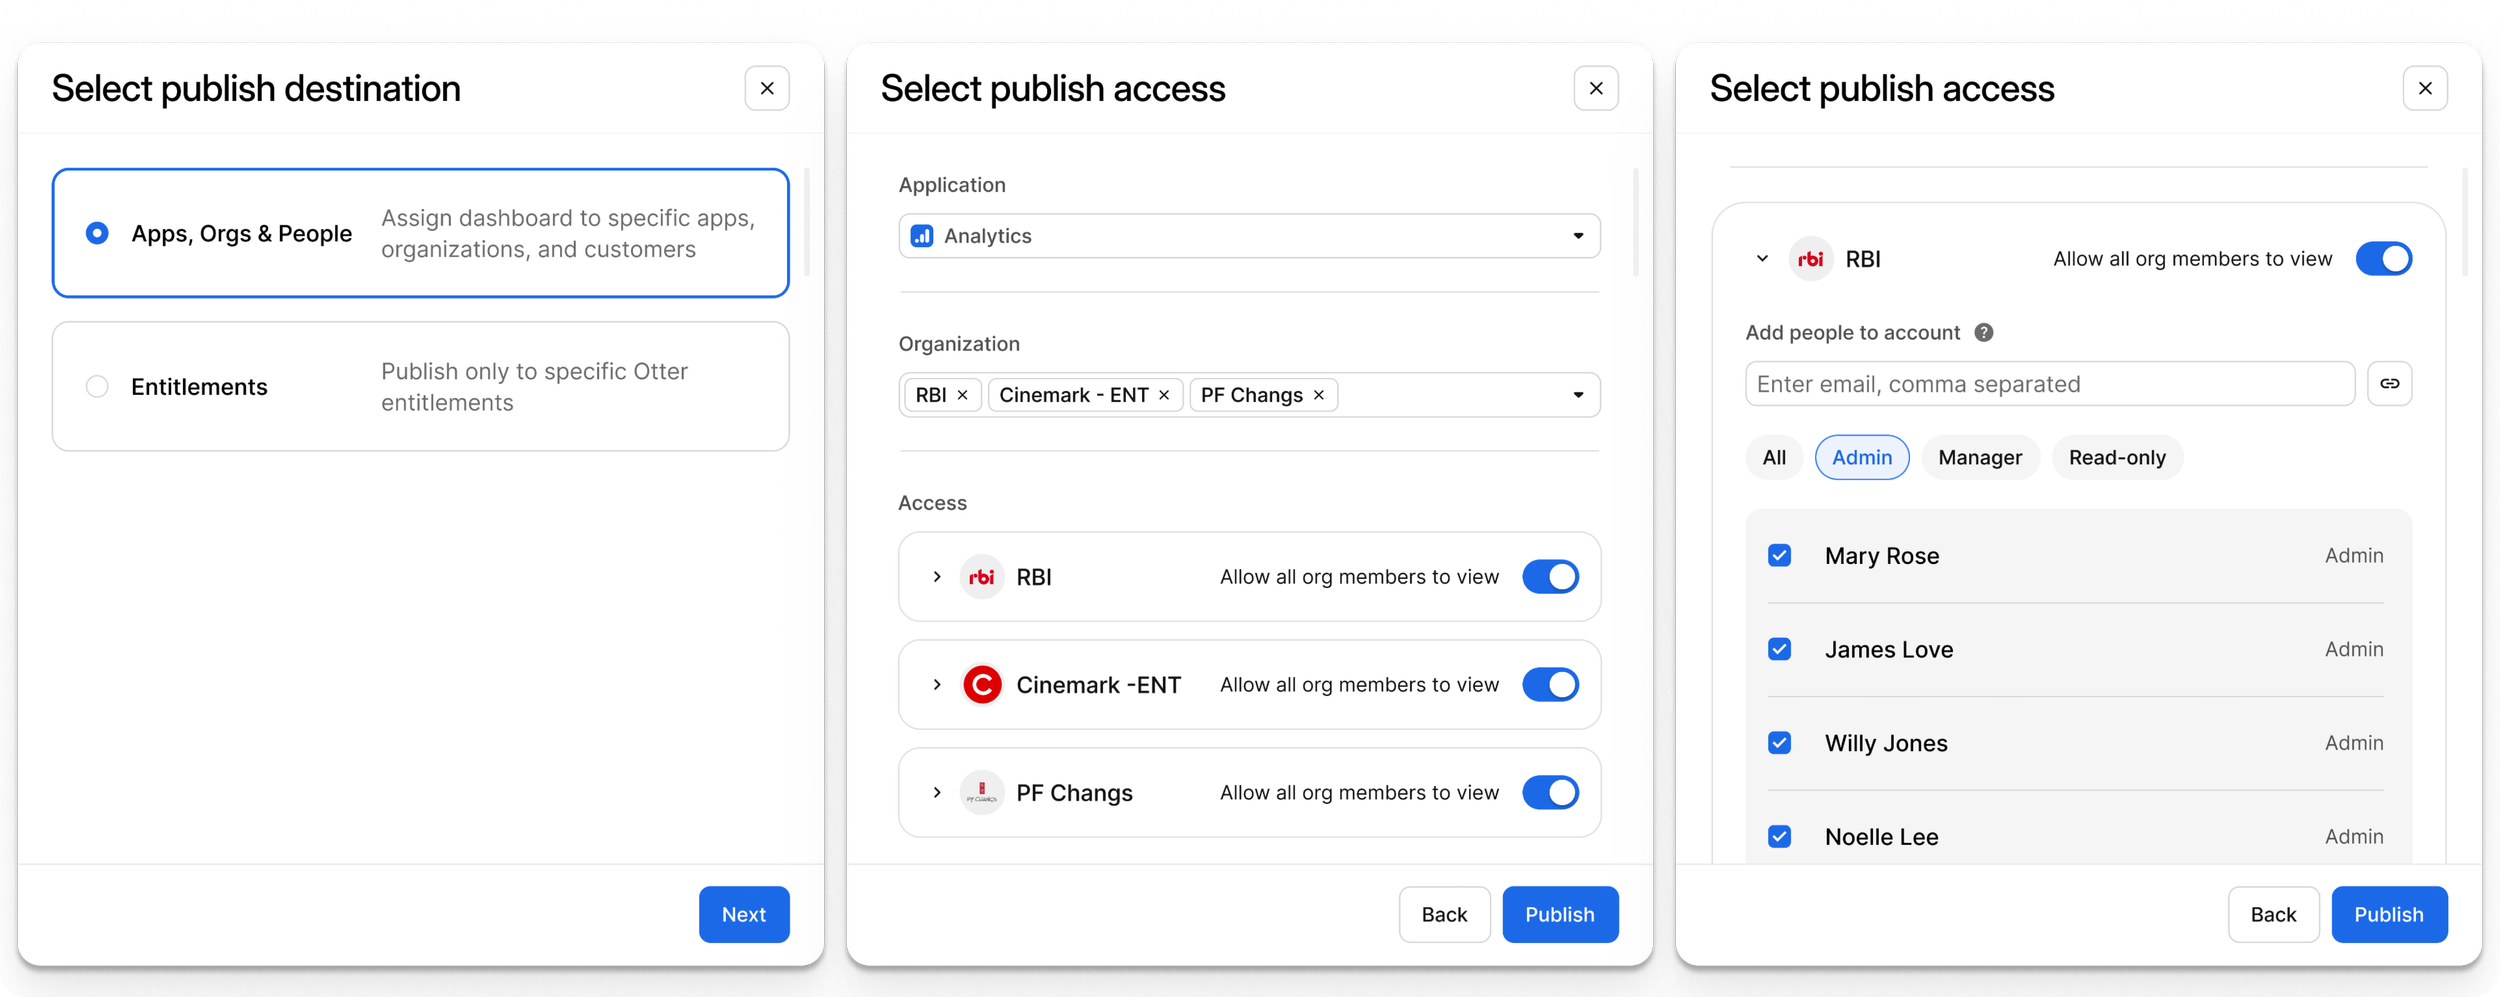
I created a new publishing experience that enables internal teams, including Account Executives, Customer Service Managers, and others, to directly publish ad-hoc custom dashboards to specific customers.
Builder view, made by internal teams such as analyzers, data scientist, and business unit teams.
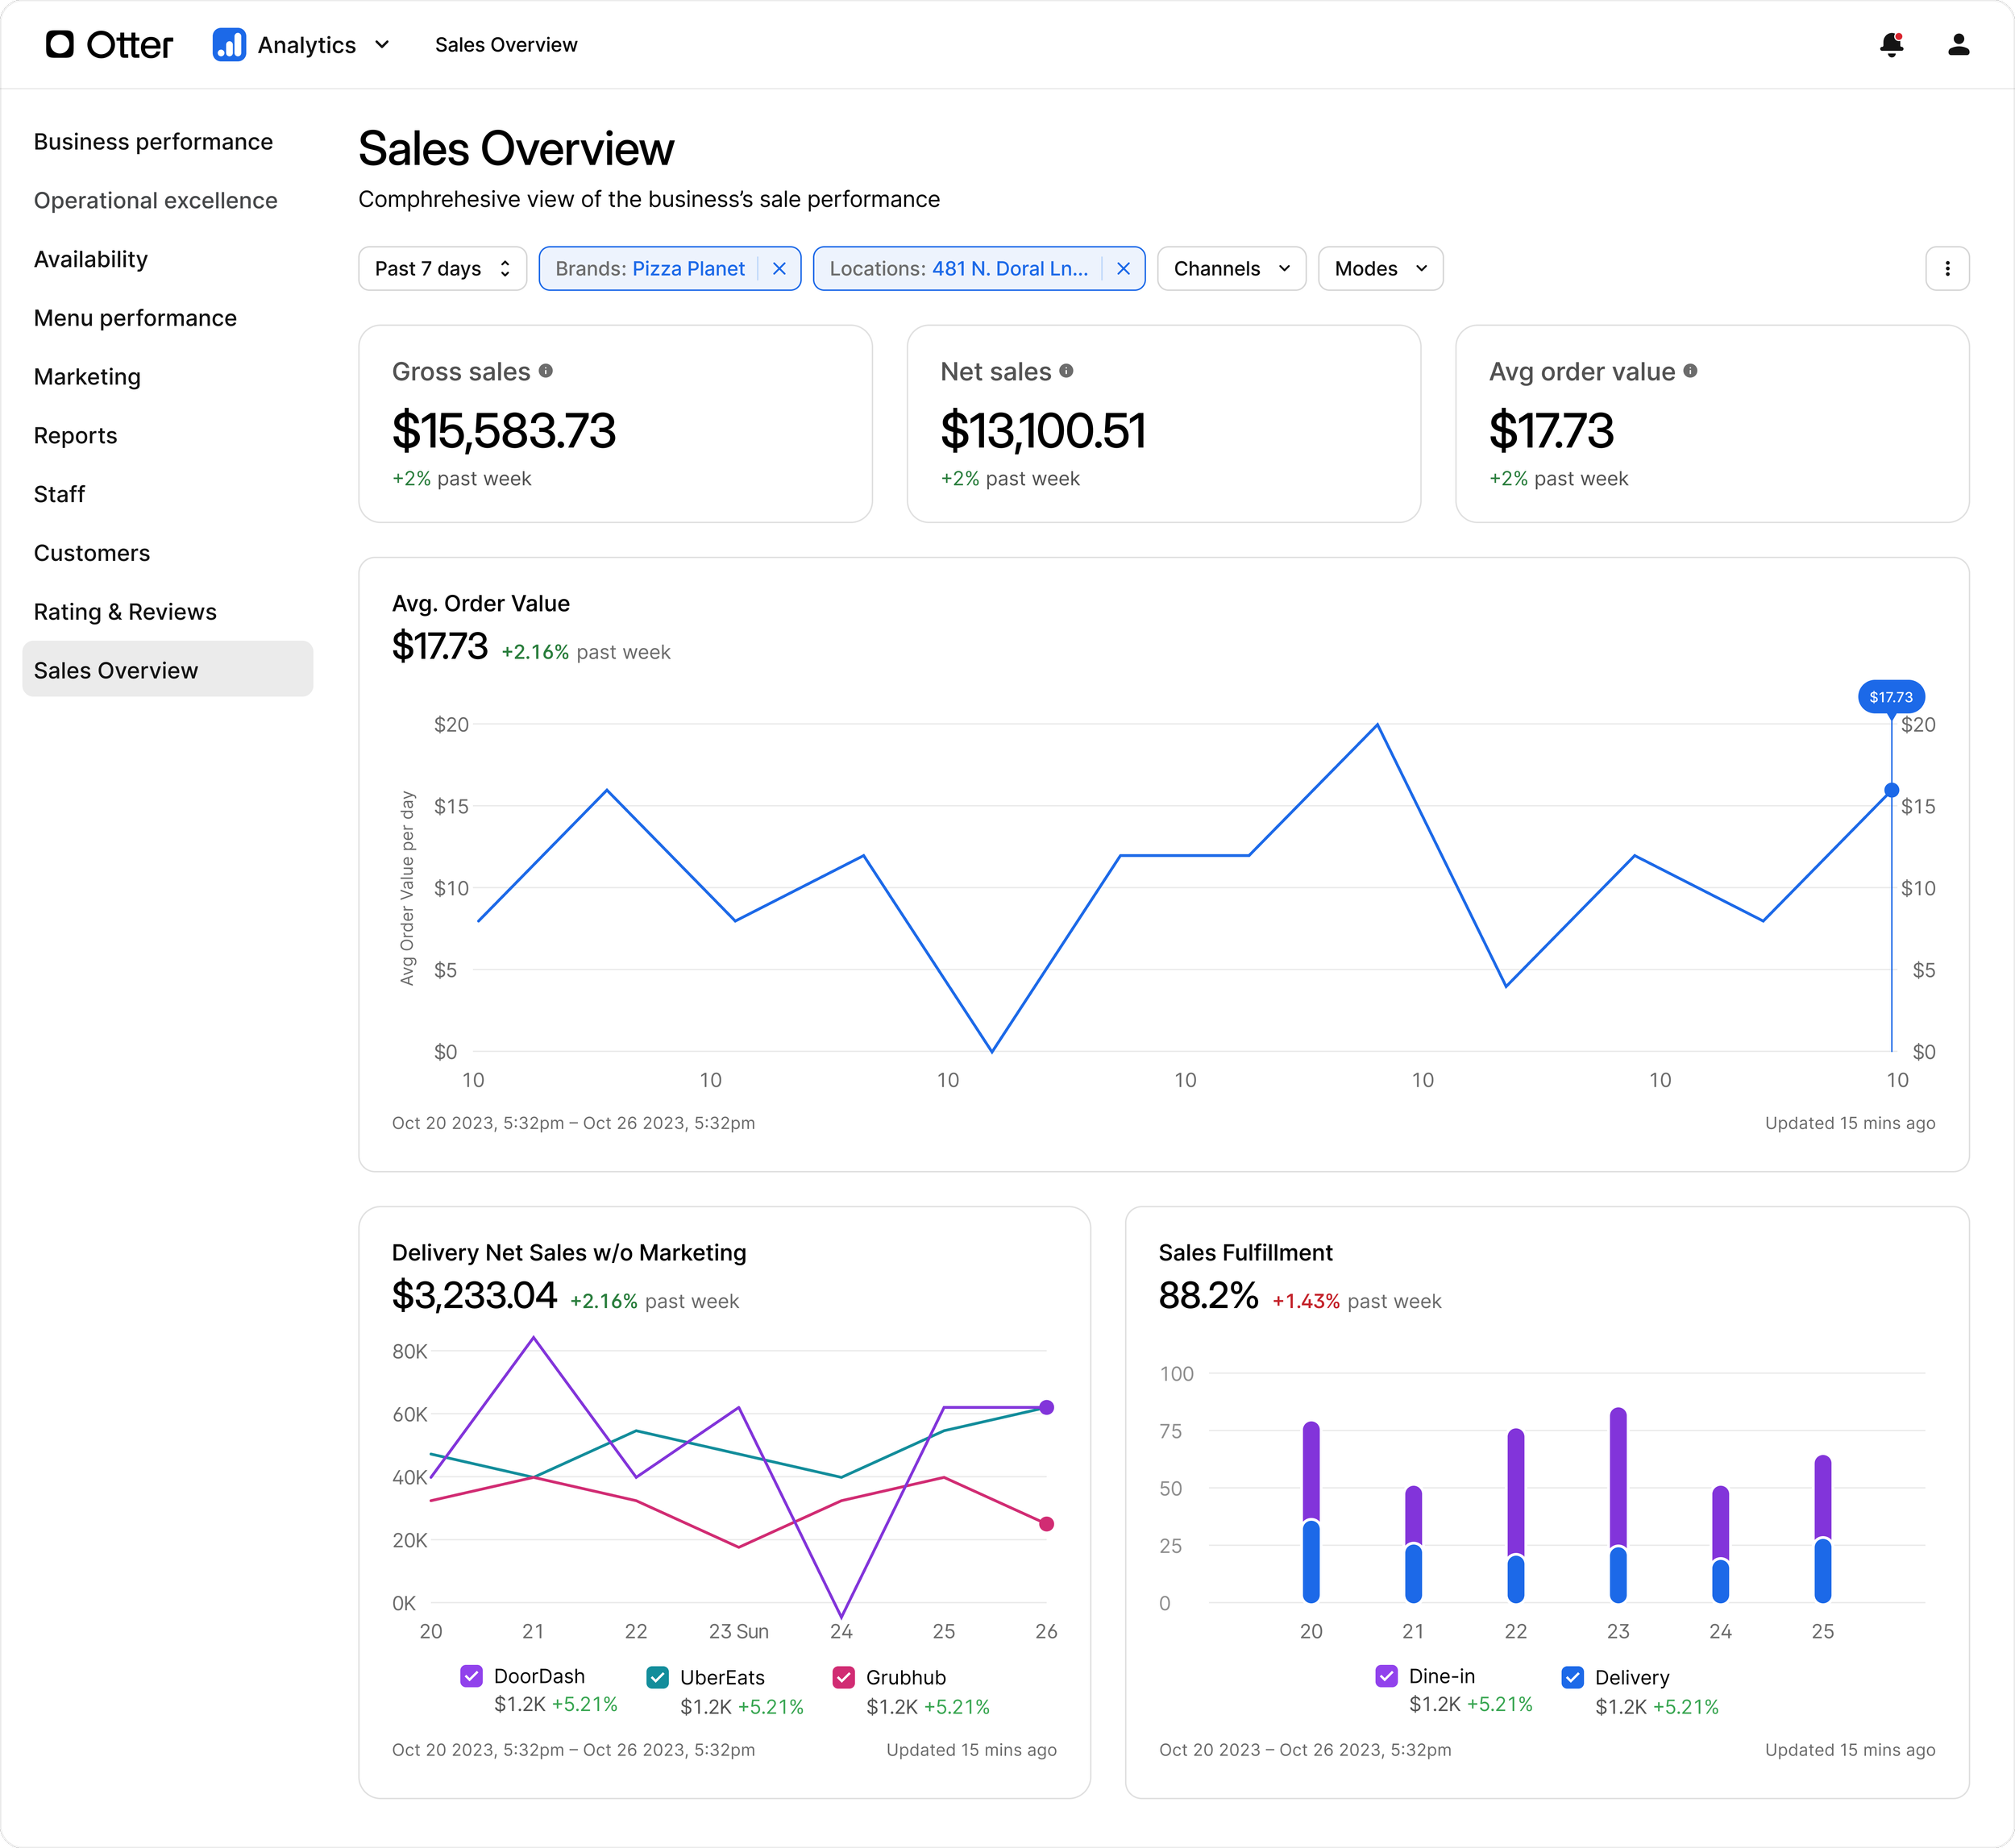
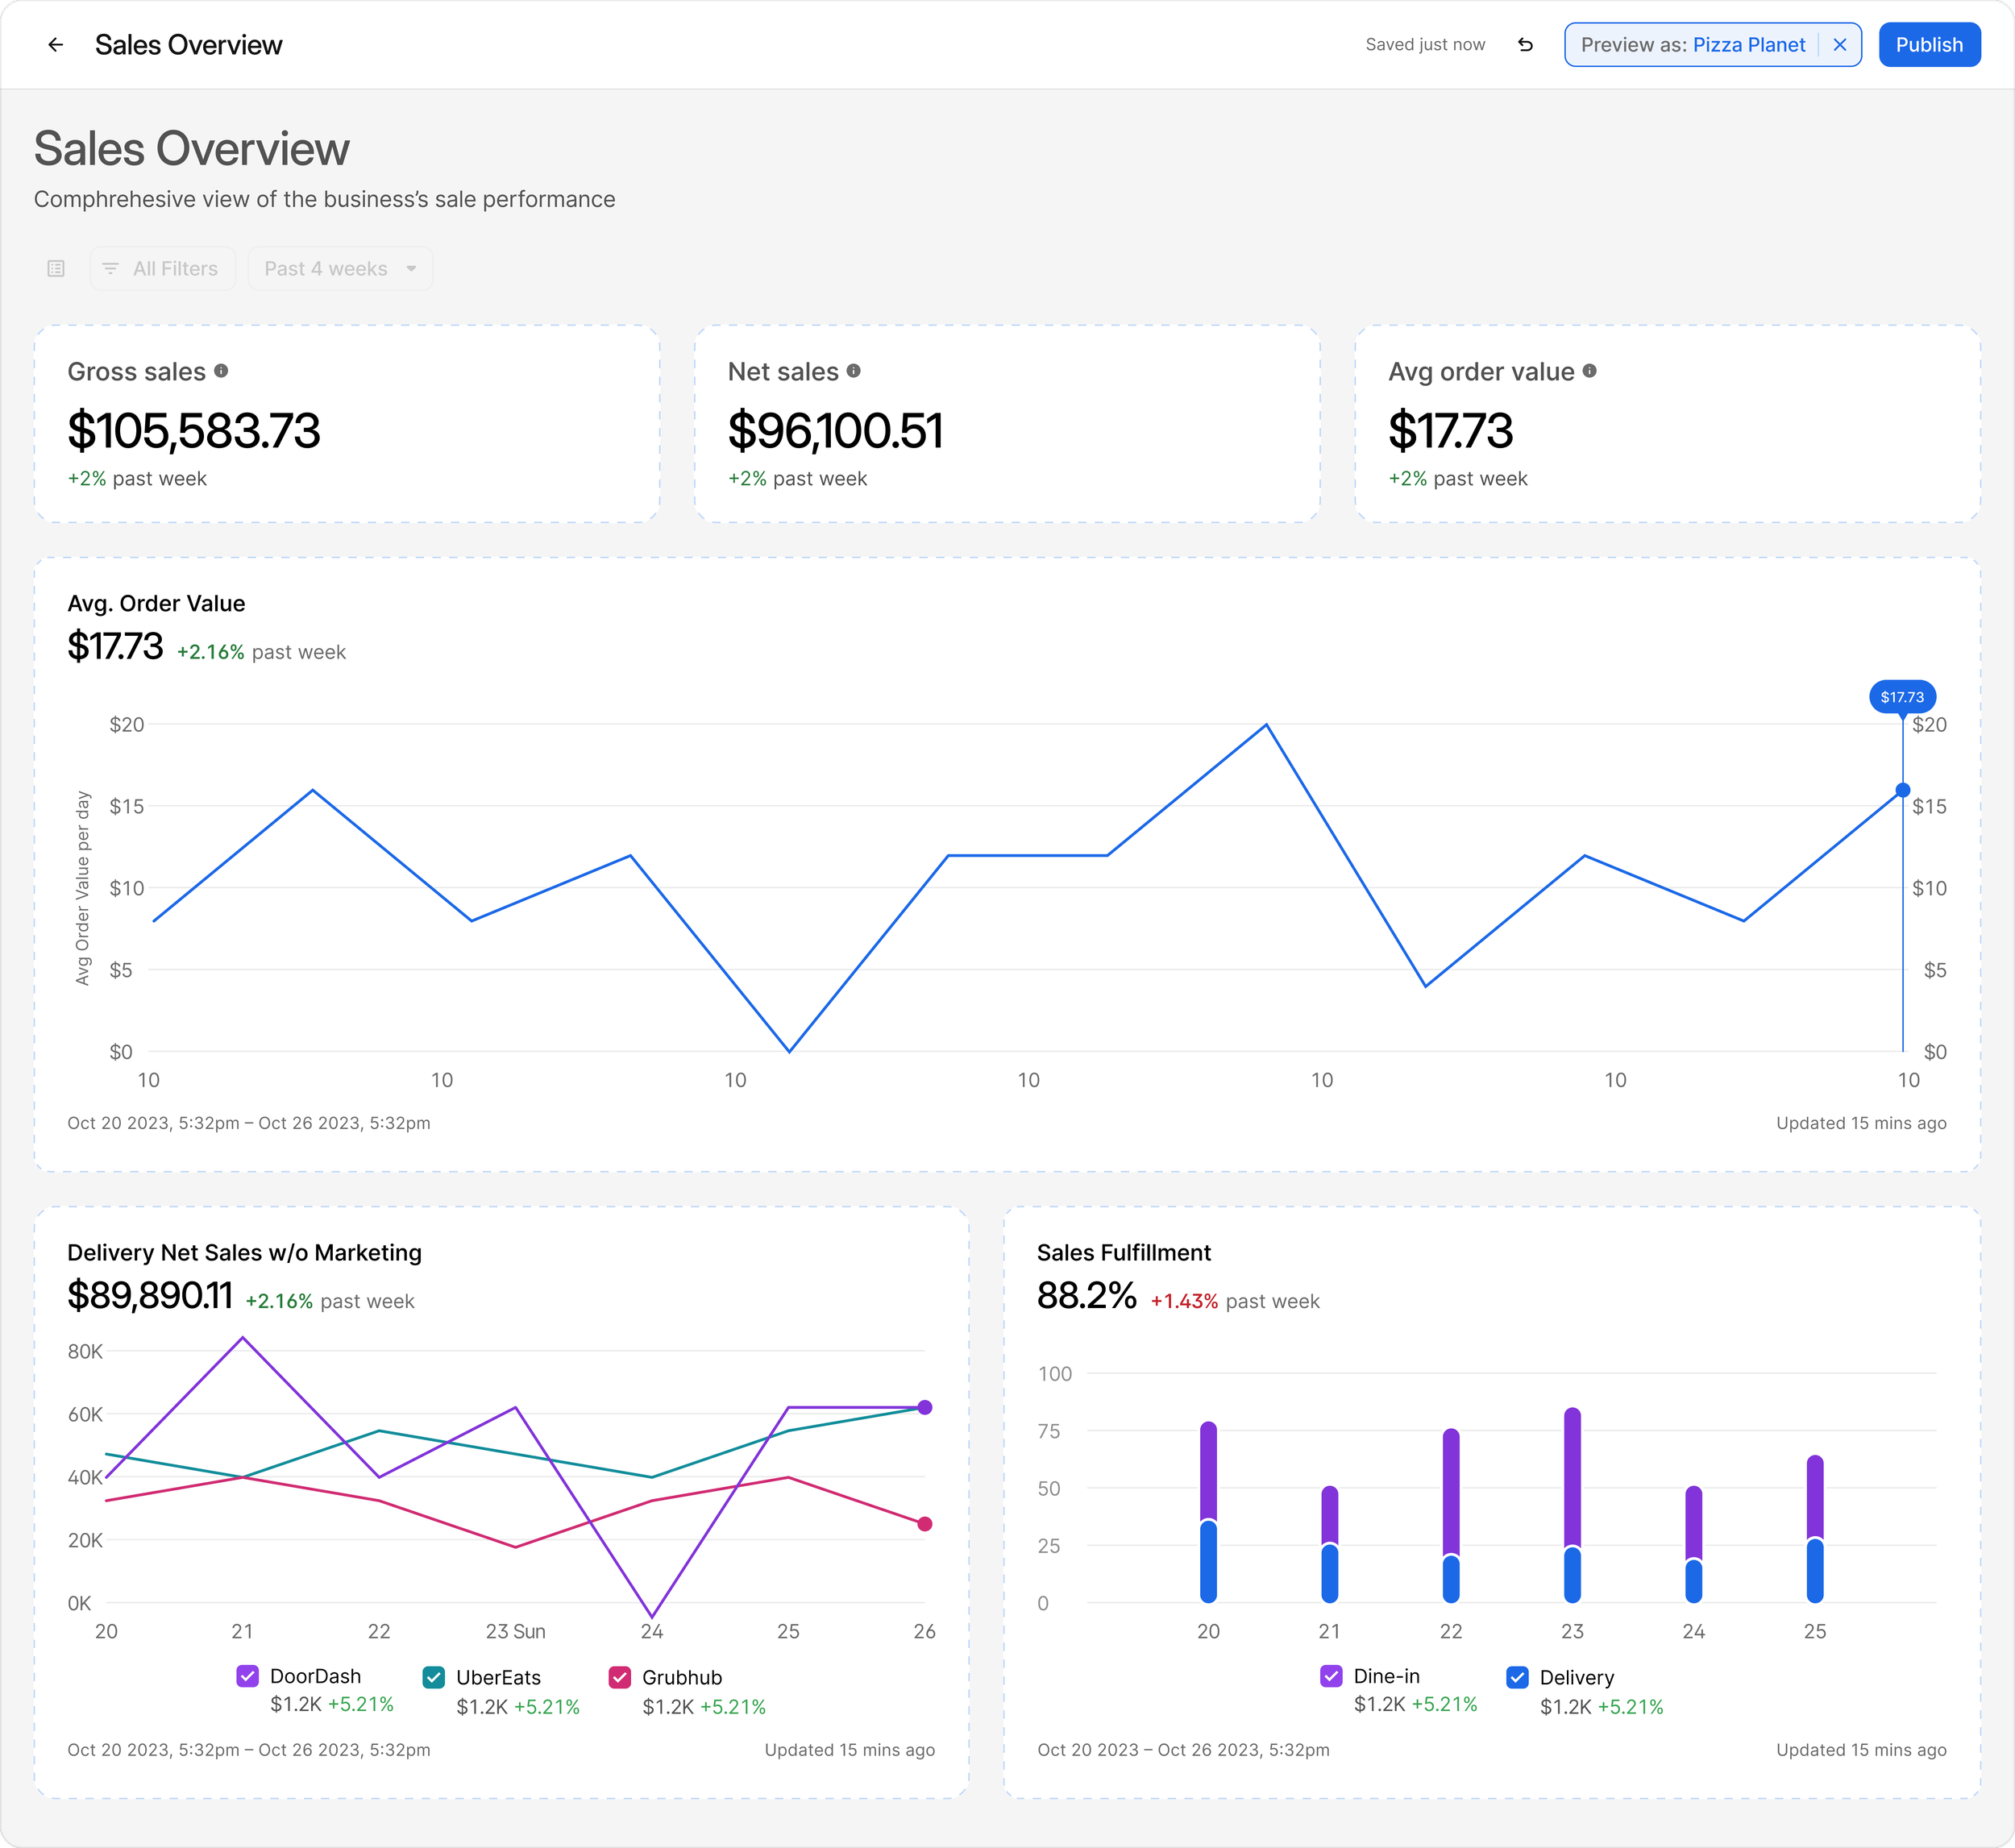
External facing dashboard tailored to the business needs of the customer. Each view is filtered based on the customer’s role and permissions.
Before
• 20 dashboard requests per month
• 2-3 dashboards per quarter delivered
First Month of Release
• 17 new customer-facing dashboards
• 45 new internal-facing dashboards within the first month of release
